Visualization of All Graphs with Five Vertices
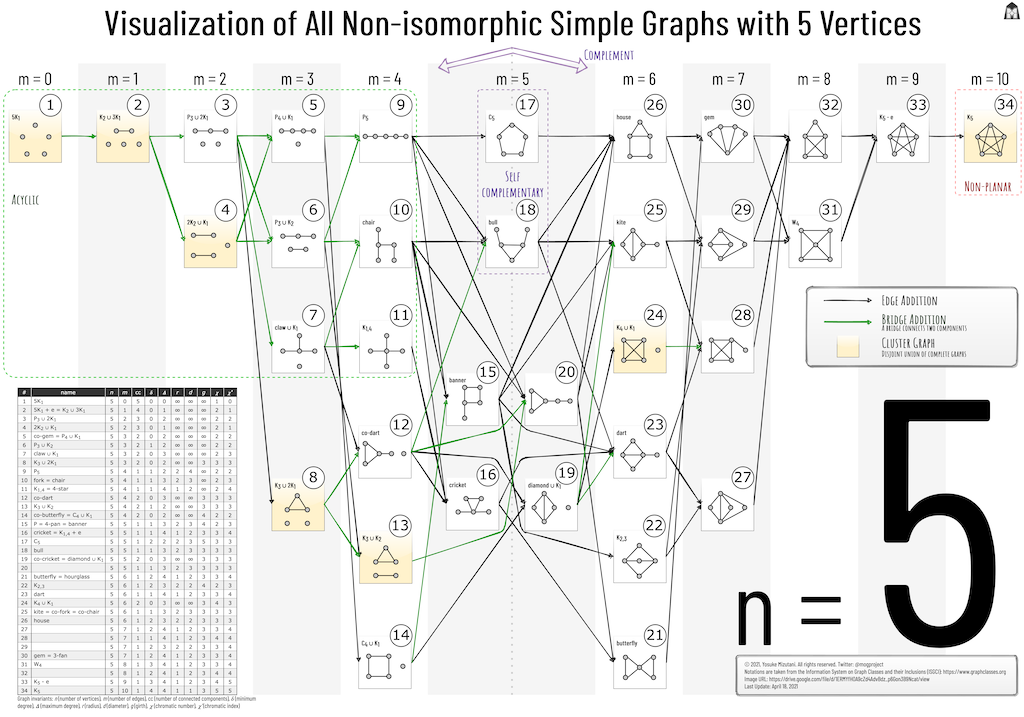
Today, I created a visualization of all non-isomorphic simple graphs with 5 vertices, with a special focus on edge editing. Cluster graphsーa disjoint union of complete graphsーare highlighted so that we can easily trace cluster editing. It also includes a table of basic graph invariants such as radius and chromatic number.

Download a hi-res image from this link.
I found this quite fascinating as it resembles the human body, like \(C_5\) being the head and the bull graph shaping a necklace. This may also help find some corner cases in your program or devise a new graph invariant. What do you think about this visualization? I hope it sparks your inspiration!
Update: Visualization is now available on my new website Graph Gallery!