Topological Analysis of LArge Scale Simulations (TALASS)
Tracking features and exploring their evolution over time has long been one of the most common analysis tasks for a variety of applications in science and technology. Usually, this proceeds in three steps: First, the feature-of-interest within a data set needs to be defined; Second, features should be correlated, i.e. tracked, between successive time steps; and Third, the resulting feature tracks need to be analyzed. Tracking graphs which show the evolution of features as a collection of feature tracks that split/merge over time are one of the most common approaches used to illustrate feature evolution over time.
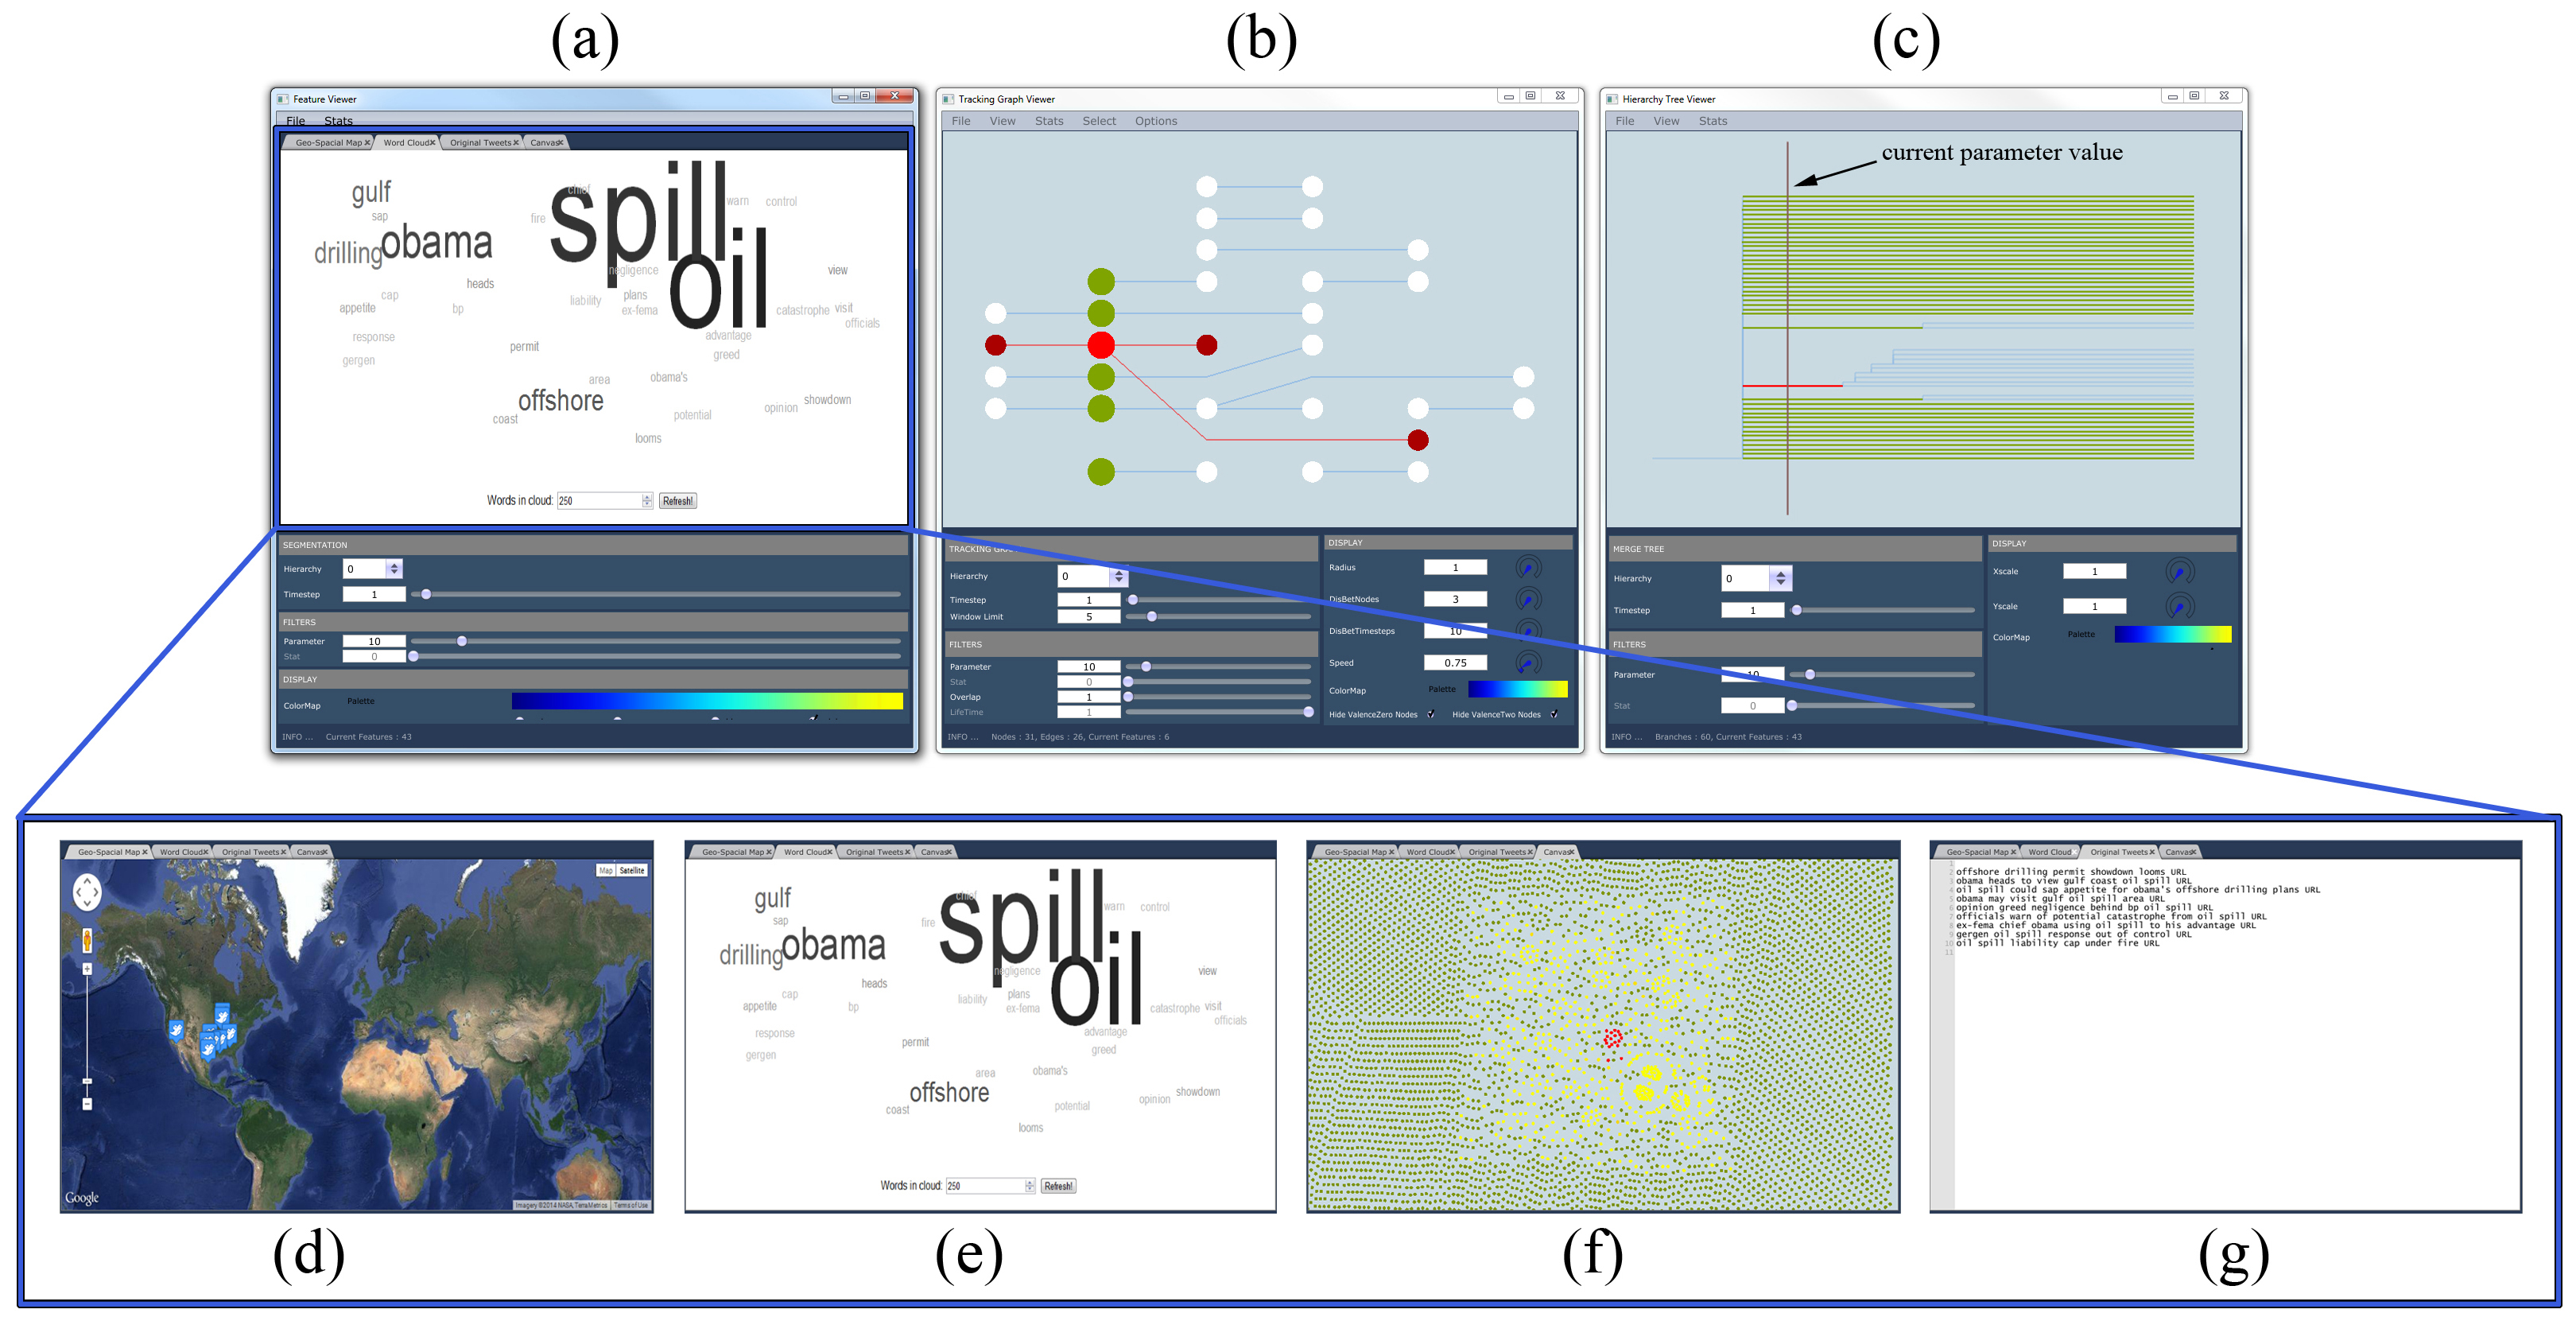
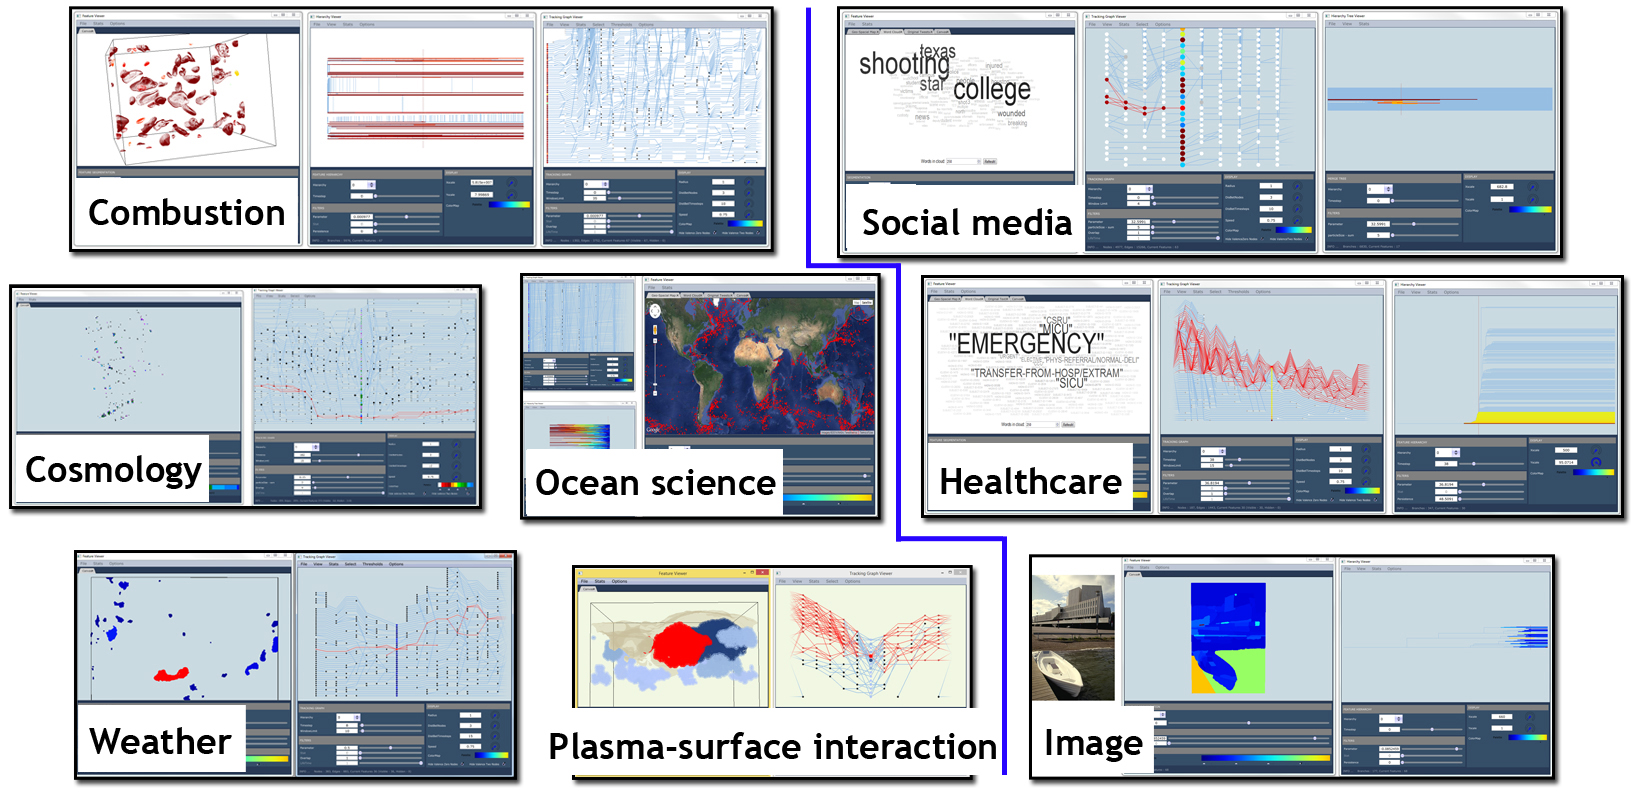
In this work, we present a general and flexible analysis environment which enables interactive exploration of feature evolution in time-varying data sets, regardless of the underlying data type. This framework couples hierarchical feature definitions with progressive graph layout algorithms to provide an interactive exploration of dynamically constructed tracking graphs. By making use of appropriate abstractions for feature definitions and their correlations and by utilizing suitable visual metaphors, we design this framework for addressing the general task of understanding feature evolution over time.

