
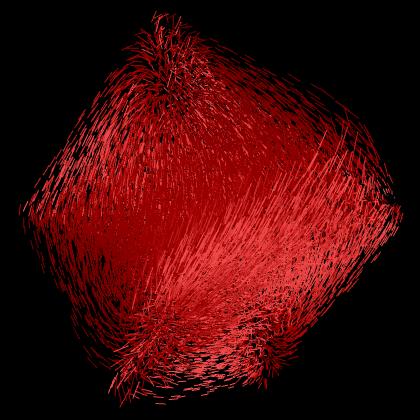
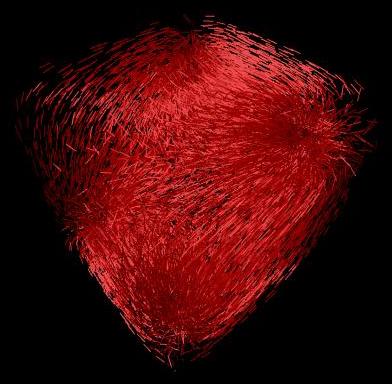
To study the effect/usefulness of different distributions used to globaly visualize vector fields. These fields are visualzied by graphicaly representing the gradients with a "quill" at a large number of points in space. The technique used is generaly refered to as a hedgehog.
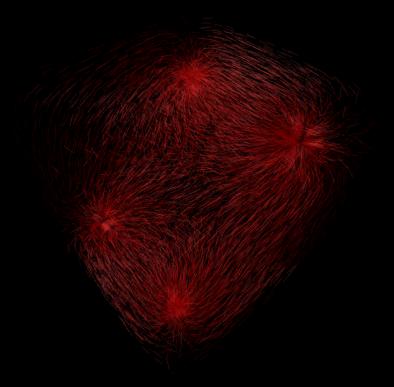
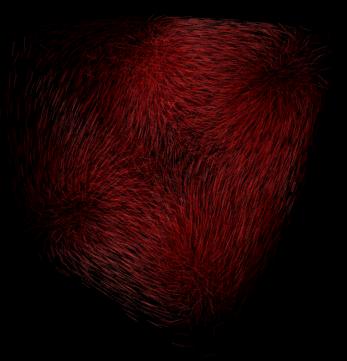
Scirun is the software I worked with, what I did is to use grid sampling and histogram seed generation techniques to generate global icons.
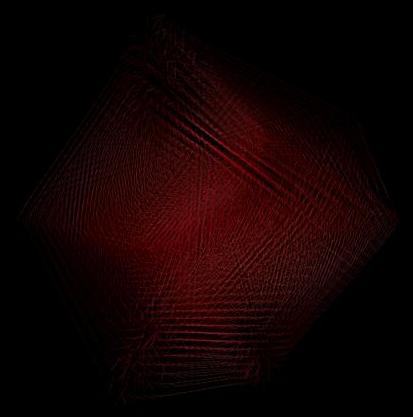
In stead of stratified random sampling, here we use grid sampling to sample according to a 3D grid. The algorithm is pretty simple, the result is not as nice as random sampling. What we are looking for is the structure of the field, but that can be biased by sampling structure -- 3D grid. That is the bad thing about grid sampling -- the global icon could be dominanted by sampling structure. On the other hand, random sampling doesn't have such kind of problem.
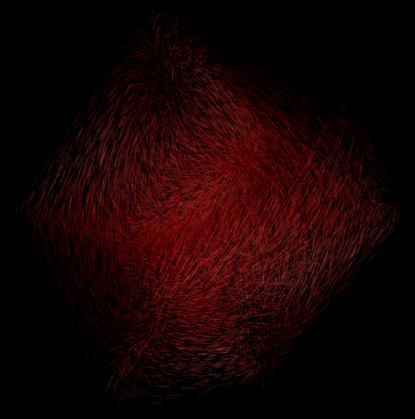
One key problem in vector field visualization is how to create sample point distributions for the hedgehog. There are many different methods to distribute points throughout the field. We can do the distribution based on volume only (uniform distribution), or gradient only (gradient distribution), or magnitude histogram probability (histogram equalization distribution). The difference is the choosing of the scalar quantity p, which corresponds to the degree of interest the user wants to put in a certain region. For example, in uniform distribution, a constant p is used, which results in a homogenous distribution of points. In gradient distribution, the value of p is proportional to vector field magnitude, so more points are sampled in regions of large magnitude. Sometimes it is useful, but in some situations such that there is a huge difference of the magnitude, the region with low magnitude will have very few points and actually become a hole in the whole icon, this is not desirable. In histogram distribution, instead of using p (vector field magnitude), we use p' which is the density distribution of p. This histogram equalization approach will definitely places seed points more homogenously than gradient distribution only approach. Here is the sum of the histogram:
               number of cells with Pi < p
     S(p) =  -------------------------------
                  total number of cells
Than we choose p'=S(p). This probability distributions can avoid some undesirable cases such as there is a huge difference in the magnitude. It is a combination of pure gradient and uniform. In some cases it really makes icons look better (no holes). But in some other cases, it may be worse. For example, the distribution of magnitude has some peaks, then this technique won't help.
Grid sampling is not as good as random sampling. Histogram Seed Generation technique is usually the best way to make your global icon looks better, but in some situation, it doesn't work. Each strategy has its own advantages and disadvantages.

 |
 |
 |
 |
 |
 |
 |
 |
 |
 |
 |