7 Plot Utilities
| (require plot/utils) | package: plot-lib |
7.1 Formatting
procedure
(digits-for-range x-min x-max [ base extra-digits]) → exact-integer? x-min : real? x-max : real? base : (and/c exact-integer? (>=/c 2)) = 10 extra-digits : exact-integer? = 3
> (digits-for-range 0.01 0.02) 5
> (digits-for-range 0 100000) -2
procedure
(real->plot-label x digits [scientific?]) → string?
x : real? digits : exact-integer? scientific? : boolean? = #t
> (let ([d (digits-for-range 0.01 0.03)]) (real->plot-label 0.02555555 d)) ".02556"
> (real->plot-label 2352343 -2) "2352300"
> (real->plot-label 1000000000.0 4) "1×10⁹"
> (real->plot-label 1000000000.1234 4) "(1×10⁹)+.1234"
procedure
(ivl->plot-label i [extra-digits]) → string?
i : ivl? extra-digits : exact-integer? = 3
> (ivl->plot-label (ivl -10.52312 10.99232)) "[-10.52,10.99]"
> (ivl->plot-label (ivl -inf.0 pi)) "[-inf.0,3.141592653589793]"
procedure
(->plot-label a [digits]) → string?
a : any/c digits : exact-integer? = 7
procedure
(real->string/trunc x e) → string?
x : real? e : exact-integer?
procedure
(real->decimal-string* x min-digits [ max-digits]) → string? x : real? min-digits : exact-nonnegative-integer? max-digits : exact-nonnegative-integer? = min-digits
> (real->decimal-string* 1 5 10) "1.00000"
> (real->decimal-string* 1.123456 5 10) "1.123456"
> (real->decimal-string* 1.123456789123456 5 10) "1.1234567891"
procedure
(integer->superscript x) → string?
x : exact-integer?
> (integer->superscript -1234567890) "⁻¹²³⁴⁵⁶⁷⁸⁹⁰"
7.2 Sampling
procedure
(linear-seq start end num [ #:start? start? #:end? end?]) → (listof real?) start : real? end : real? num : exact-nonnegative-integer? start? : boolean? = #t end? : boolean? = #t
This function is used internally to generate sample points.
> (linear-seq 0 1 5) '(0 1/4 1/2 3/4 1)
> (linear-seq 0 1 5 #:start? #f) '(1/9 1/3 5/9 7/9 1)
> (linear-seq 0 1 5 #:end? #f) '(0 2/9 4/9 2/3 8/9)
> (linear-seq 0 1 5 #:start? #f #:end? #f) '(1/10 3/10 1/2 7/10 9/10)
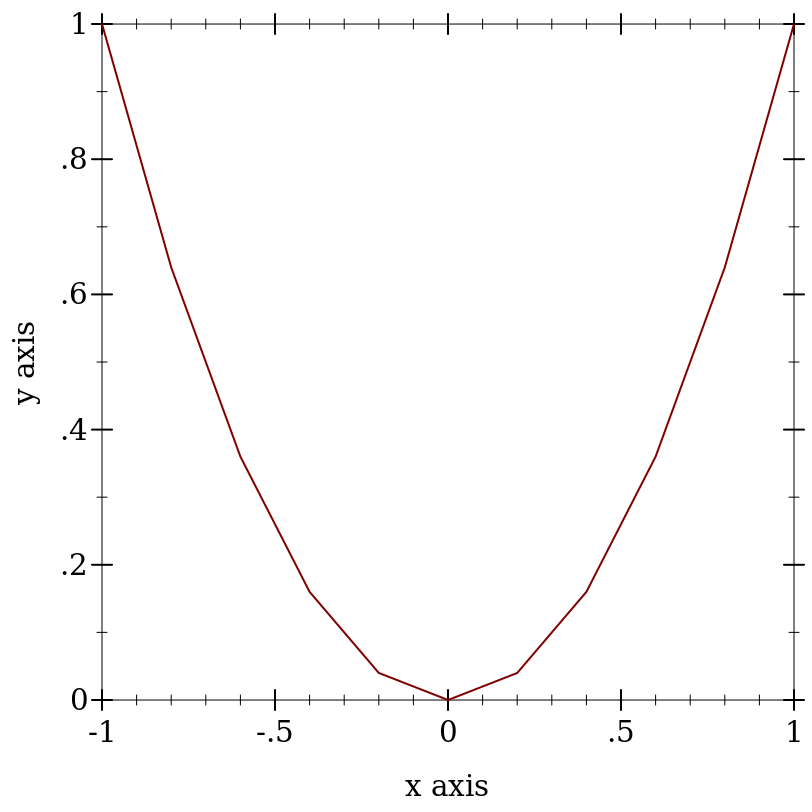
> (define xs (linear-seq -1 1 11)) > (plot (lines (map vector xs (map sqr xs))))
procedure
(linear-seq* points num [ #:start? start? #:end? end?]) → (listof real?) points : (listof real?) num : exact-nonnegative-integer? start? : boolean? = #t end? : boolean? = #t
> (linear-seq* '(0 1 2) 5) '(0 1/2 1 3/2 2)
> (linear-seq* '(0 1 2) 6) '(0 2/5 4/5 6/5 8/5 2)
> (linear-seq* '(0 1 0) 5) '(0 1/2 1 1/2 0)
procedure
(nonlinear-seq start end num transform [ #:start? start? #:end? end?]) → (listof real?) start : real? end : real? num : exact-nonnegative-integer? transform : axis-transform/c start? : boolean? = #t end? : boolean? = #t
> (linear-seq 1 10 4) '(1 4 7 10)
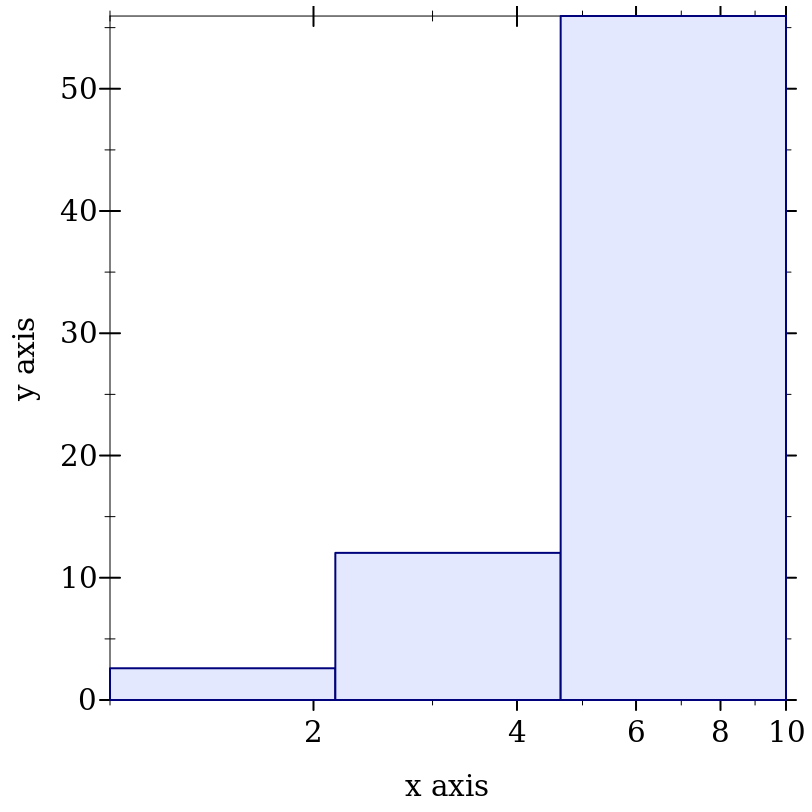
> (nonlinear-seq 1 10 4 log-transform) '(1.0 2.154434690031884 4.641588833612779 10.000000000000002)
> (parameterize ([plot-x-transform log-transform]) (plot (area-histogram sqr (nonlinear-seq 1 10 4 log-transform))))
procedure
(kde xs h [ws]) →
(-> real? real?) (or/c rational? #f) (or/c rational? #f) xs : (listof real?) h : (>/c 0) ws : (or/c (listof (>=/c 0)) #f) = #f
procedure
(silverman-bandwidth xs) → real?
xs : (listof real?)
Added in version 8.5 of package plot-lib.
7.3 Plot Colors and Styles
procedure
(color-seq c1 c2 num [ #:start? start? #:end? end?]) → (listof (list/c real? real? real?)) c1 : color/c c2 : color/c num : exact-nonnegative-integer? start? : boolean? = #t end? : boolean? = #t
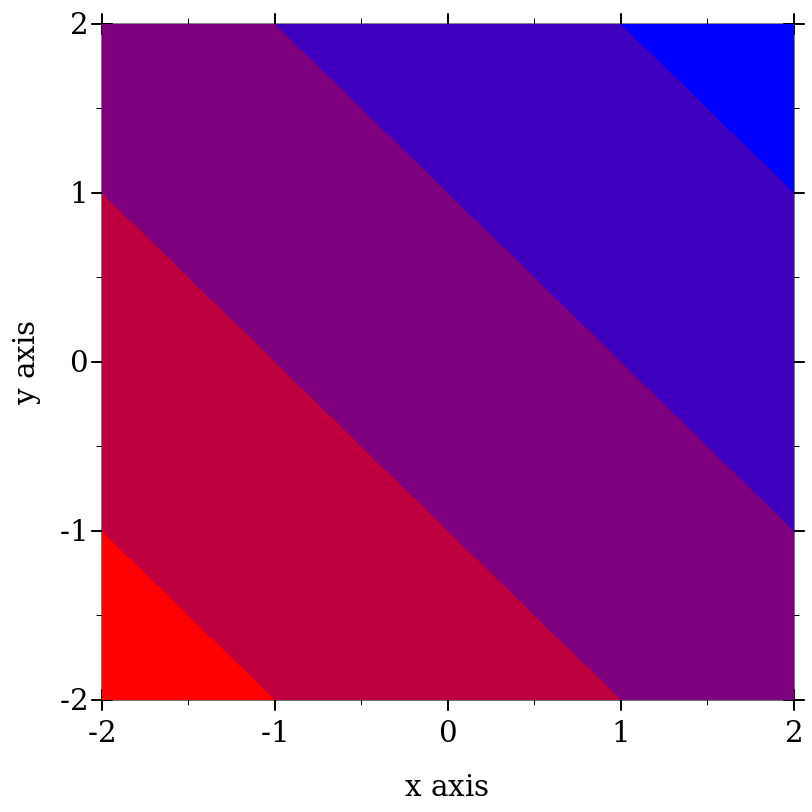
> (plot (contour-intervals (λ (x y) (+ x y)) -2 2 -2 2 #:levels 4 #:contour-styles '(transparent) #:colors (color-seq "red" "blue" 5)))
procedure
(color-seq* colors num [ #:start? start? #:end? end?]) → (listof (list/c real? real? real?)) colors : (listof color/c) num : exact-nonnegative-integer? start? : boolean? = #t end? : boolean? = #t
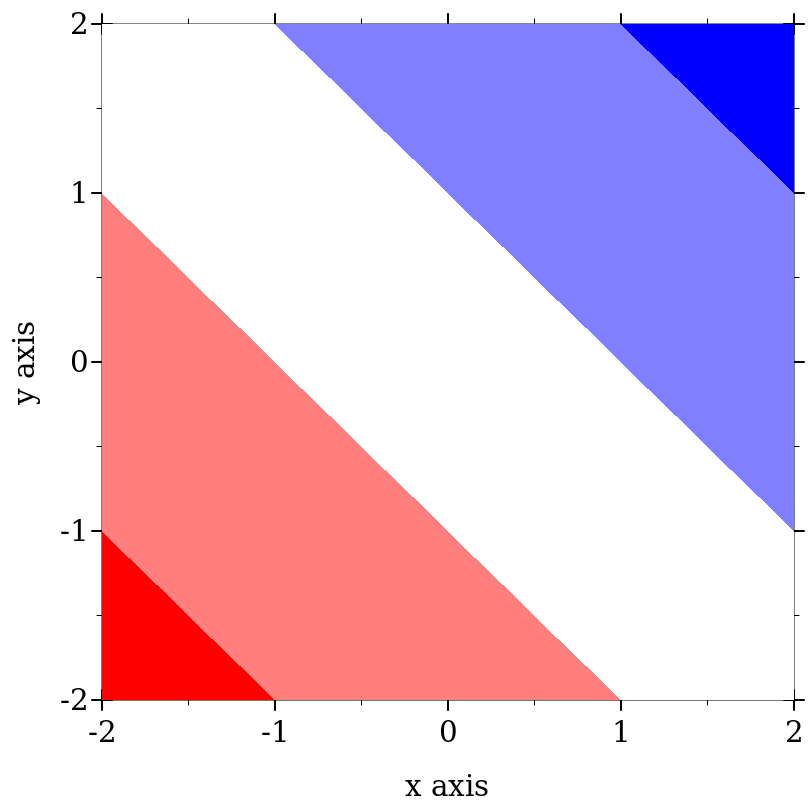
> (plot (contour-intervals (λ (x y) (+ x y)) -2 2 -2 2 #:levels 4 #:contour-styles '(transparent) #:colors (color-seq* '(red white blue) 5)))
Symbols are converted to strings, and strings are looked up in a color-database<%>. Lists are unchanged, and color% objects are converted straightforwardly.
> (->color 'navy) '(36 36 140)
> (->color "navy") '(36 36 140)
> (->color '(36 36 140)) '(36 36 140)
> (->color (make-object color% 36 36 140)) '(36 36 140)
This function does not convert integers to RGB triplets, because there is no way for it to know whether the color will be used for a pen or for a brush. Use ->pen-color and ->brush-color to convert integers.
procedure
(->pen-color c) → (list/c real? real? real?)
c : plot-color/c
> (equal? (->pen-color 0) (->pen-color 8)) #f
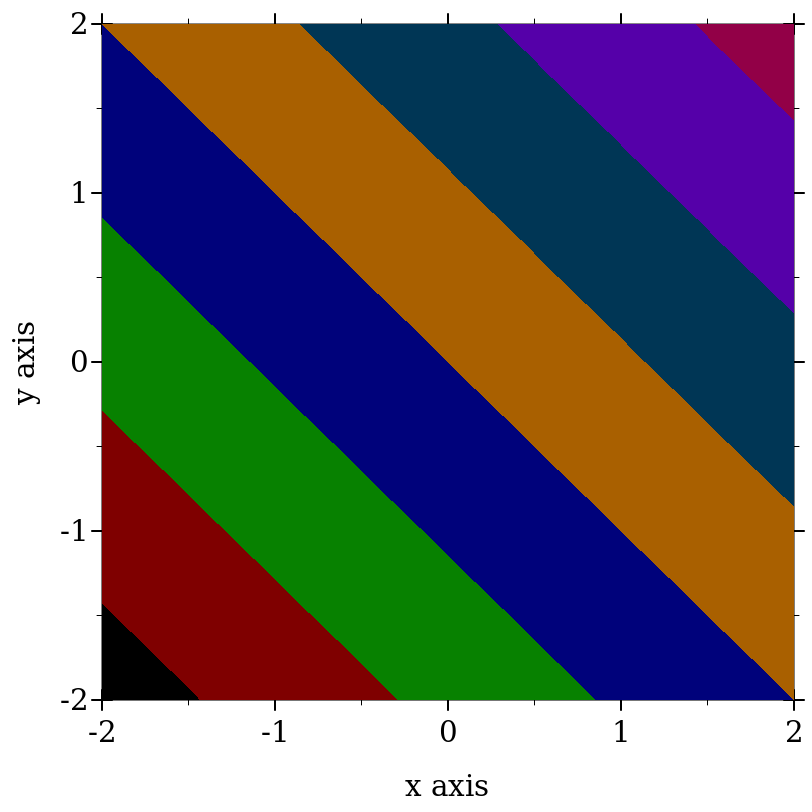
> (plot (contour-intervals (λ (x y) (+ x y)) -2 2 -2 2 #:levels 7 #:contour-styles '(transparent) #:colors (map ->pen-color (build-list 8 values))))
The example above is using the internal color map, with plot-pen-color-map set to #f.
procedure
(->brush-color c) → (list/c real? real? real?)
c : plot-color/c
> (equal? (->brush-color 0) (->brush-color 8)) #f
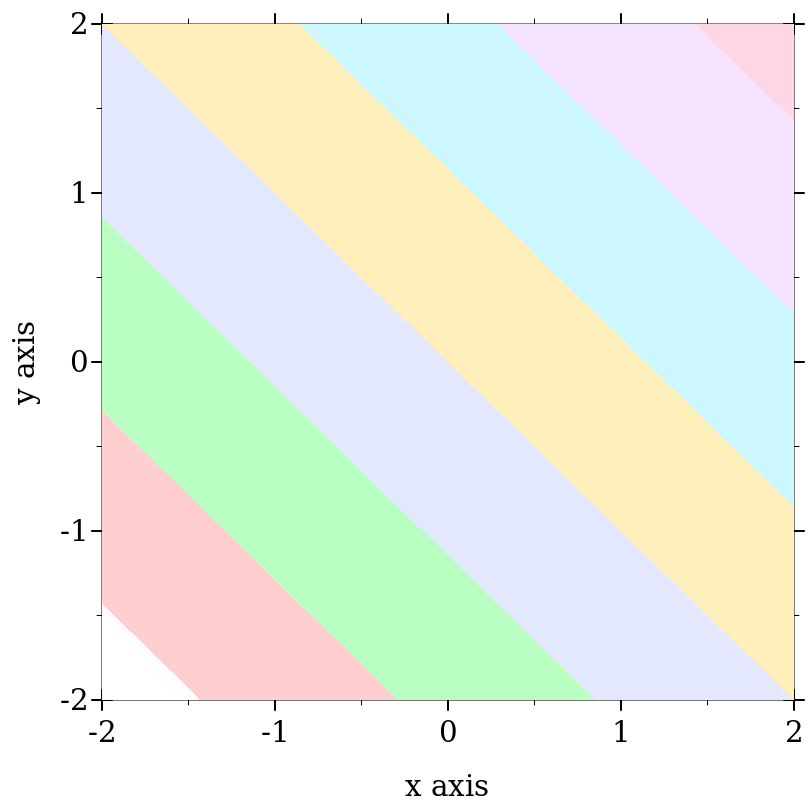
> (plot (contour-intervals (λ (x y) (+ x y)) -2 2 -2 2 #:levels 7 #:contour-styles '(transparent) #:colors (map ->brush-color (build-list 8 values))))
The example above is using the internal color map, with plot-brush-color-map is set to #f. In this example, mapping ->brush-color over the list is actually unnecessary, because contour-intervals uses ->brush-color internally to convert fill colors.
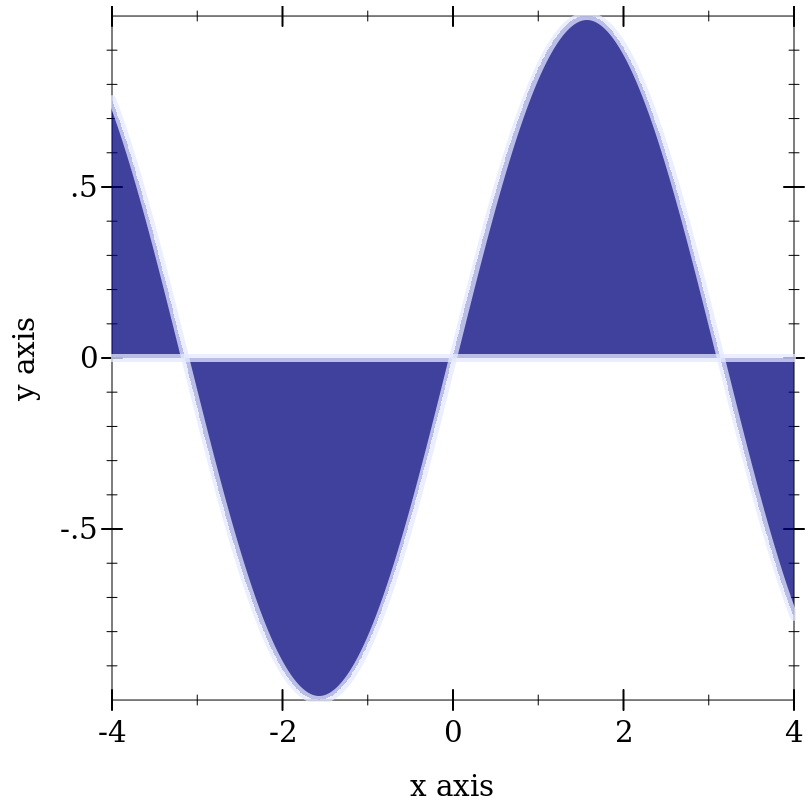
> (plot (function-interval sin (λ (x) 0) -4 4 #:color (->pen-color 3) #:line1-color (->brush-color 3) #:line2-color (->brush-color 3) #:line1-width 4 #:line2-width 4))
procedure
(->pen-style s) → symbol?
s : plot-pen-style/c
> (eq? (->pen-style 0) (->pen-style 5)) #t
> (map ->pen-style '(0 1 2 3 4)) '(solid dot long-dash short-dash dot-dash)
procedure
(->brush-style s) → symbol?
s : plot-brush-style/c
> (eq? (->brush-style 0) (->brush-style 7)) #t
> (map ->brush-style '(0 1 2 3)) '(solid bdiagonal-hatch fdiagonal-hatch crossdiag-hatch)
> (map ->brush-style '(4 5 6)) '(horizontal-hatch vertical-hatch cross-hatch)
procedure
(color-map-names) → (listof symbol?)
Added in version 7.3 of package plot-lib.
procedure
(color-map-size name) → integer?
name : symbol?
Added in version 7.3 of package plot-lib.
procedure
(register-color-map name color-map) → void
name : symbol? color-map : (vectorof (list byte? byte? byte?))
Added in version 7.3 of package plot-lib.
7.4 Plot-Specific Math
7.4.1 Real Functions
procedure
(3d-polar->3d-cartesian θ ρ r) → (vector/c real? real? real?)
θ : real? ρ : real? r : real?
procedure
(ceiling-log/base b x) → exact-integer?
b : (and/c exact-integer? (>=/c 2)) x : (>/c 0)
> (ceiling (/ (log 100) (log 10))) 2.0
> (ceiling-log/base 10 100) 2
> (ceiling (/ (log 1/1000) (log 10))) -2.0
> (ceiling-log/base 10 1/1000) -3
procedure
(floor-log/base b x) → exact-integer?
b : (and/c exact-integer? (>=/c 2)) x : (>/c 0)
> (floor (/ (log 100) (log 10))) 2.0
> (floor-log/base 10 100) 2
> (floor (/ (log 1000) (log 10))) 2.0
> (floor-log/base 10 1000) 3
procedure
(maybe-inexact->exact x) → (or/c rational? #f)
x : (or/c rational? #f)
7.4.2 Vector Functions
procedure
v1 : (vectorof real?) v2 : (vectorof real?)
procedure
v1 : (vectorof real?) v2 : (vectorof real?)
procedure
v : (vectorof real?)
procedure
v : (vectorof real?) c : real?
procedure
v : (vectorof real?) c : real?
procedure
(vnormalize v) → (vectorof real?)
v : (vectorof real?)
> (vnormalize #(1 1 0)) '#(0.7071067811865475 0.7071067811865475 0)
> (vnormalize #(1 1 1)) '#(0.5773502691896258 0.5773502691896258 0.5773502691896258)
> (vnormalize #(0 0 0.0)) '#(0 0 0.0)
> (vcenter '(#(1 1) #(2 2))) '#(3/2 3/2)
procedure
(vrational? v) → boolean?
v : (vectorof real?)
> (vrational? #(1 2)) #t
> (vrational? #(+inf.0 2)) #f
> (vrational? #(#f 1)) vrational?: contract violation
expected: real?
given: #f
in: an element of
the 1st argument of
(-> (vectorof real?) any)
contract from:
<pkgs>/plot-lib/plot/private/common/math.rkt
blaming: top-level
(assuming the contract is correct)
at: <pkgs>/plot-lib/plot/private/common/math.rkt:304:9
7.4.3 Intervals and Interval Functions
> (ivl -inf.0 0) (ivl -inf.0 0)
> (ivl 0 +inf.0) (ivl 0 +inf.0)
> (ivl -inf.0 +inf.0) (ivl -inf.0 +inf.0)
Functions that return rectangle renderers, such as rectangles and discrete-histogram3d, accept vectors of ivls as arguments. The ivl struct type is also provided by plot so users of such renderers do not have to require plot/utils.
procedure
(rational-ivl? i) → boolean?
i : any/c
> (map rational-ivl? (list (ivl -1 1) (ivl -inf.0 2) 'bob)) '(#t #f #f)
procedure
(bounds->intervals xs) → (listof ivl?)
xs : (listof real?)
> (bounds->intervals (linear-seq 0 1 5)) (list (ivl 0 1/4) (ivl 1/4 1/2) (ivl 1/2 3/4) (ivl 3/4 1))
procedure
(clamp-real x i) → real?
x : real? i : ivl?
7.5 Dates and Times
procedure
(datetime->real x) → real?
x : (or/c plot-time? date? date*? sql-date? sql-time? sql-timestamp?)
For dates, the value returned is the number of seconds since a system-dependent UTC epoch. See date-ticks for more information.
To plot a time series using dates pulled from an SQL database, simply set the relevant axis ticks (probably plot-x-ticks) to date-ticks, and convert the dates to seconds using datetime->real before passing them to lines. To keep time zone offsets from influencing the plot, set them to 0 first.
struct
(struct plot-time (second minute hour day) #:extra-constructor-name make-plot-time) second : (and/c (>=/c 0) (</c 60)) minute : (integer-in 0 59) hour : (integer-in 0 23) day : exact-integer?
Plot (specifically time-ticks) uses plot-time internally to format times, but because renderer-producing functions require only real values, user code should not need it. It is provided just in case.
procedure
(plot-time->seconds t) → real?
t : plot-time?
procedure
(seconds->plot-time s) → plot-time?
s : real?
> (define (plot-time+ t1 t2) (seconds->plot-time (+ (plot-time->seconds t1) (plot-time->seconds t2))))
> (plot-time+ (plot-time 32 0 12 1) (plot-time 32 0 14 1)) (plot-time 4 1 2 3)
7.6 Plot Metrics
|
Return the bounds of the plot as a vector of minimum and maximum values, one for each axis in the plot. For 2D plots, this method returns a vector of two elements, for the X and Y axes, while 3D plots return a vector of three elements for the X, Y and Z axes.The values returned are in plot coordinates, to obtain the coordinates on the drawing surface (i.e. image coordinates), use plot->dc on these bounds.
Plot bounds for interactive plots, like those produced by plot and plot-snip, can change as the user zoom in and out the plot, get-plot-bounds always returns the current bounds of the plot, but they might be invalidated by a user operation.
Convert coordinates from plot coordinate system to the drawing coordinate system (that is, image coordinates). For 2D plots, coordinates is a vector of two values, the X and Y coordinates on the plot, while for 3D plots it is a vector of three values, the X, Y and Z coordinates.This method can be used, for example, to determine the actual location on the image where the coordinates 0, 0 are. It can also be used to determine the location of the plot area inside the image, by calling it on the plot bounds returned by get-plot-bounds.
For interactive plots, the coordinates might change as the user zooms in and out the plot.
For 2D plots, this method returns the 2D plot coordinates that correspond to the input coordinates, which are in the draw context coordinate system.For 3D plots, this method returns a 3D position on the plane perpendicular to the user view for the plot. Together with the normal vector for this plane, returned by plane-vector, the projection line can be reconstructed.
This is the reverse operation from plot->dc and same remark about the user zooming in and out the plot applies.
method
(send a-plot-metrics plane-vector) → (vectorof real?)
Return the unit vector representing the normal of the screen through the plot origin. For 2D plots this always returns #(0 0 1), for 3D plots this unit vector can be used to reconstruct plot coordinates from draw context coordinates.For interactive 3D plots, the returned value will change if the user rotates the plot.
Added in version 8.1 of package plot-lib.
procedure
(plot-pict? any) → boolean?
any : any/c
Added in version 8.1 of package plot-lib.
procedure
(plot-pict-bounds plot) → (vectorof (vector/c real? real?))
plot : plot-pict?
Added in version 8.1 of package plot-lib.
procedure
(plot-pict-plot->dc plot coordinates) → (vectorof real?)
plot : plot-pict? coordinates : (vectorof real?)
Added in version 8.1 of package plot-lib.
procedure
(plot-pict-dc->plot plot coordinates) → (vectorof real?)
plot : plot-pict? coordinates : (vectorof real?)
Added in version 8.1 of package plot-lib.
procedure
(plot-pict-plane-vector plot) → (vectorof real?)
plot : plot-pict?
Added in version 8.1 of package plot-lib.
